Azure & Cloud Architecture
Observability for .NET Applications with Application Insights
Application Insights is a telemetry backend, not an observability strategy. Useful instrumentation starts with questions about user journeys, dependency failure and change-not with collecting every available event.
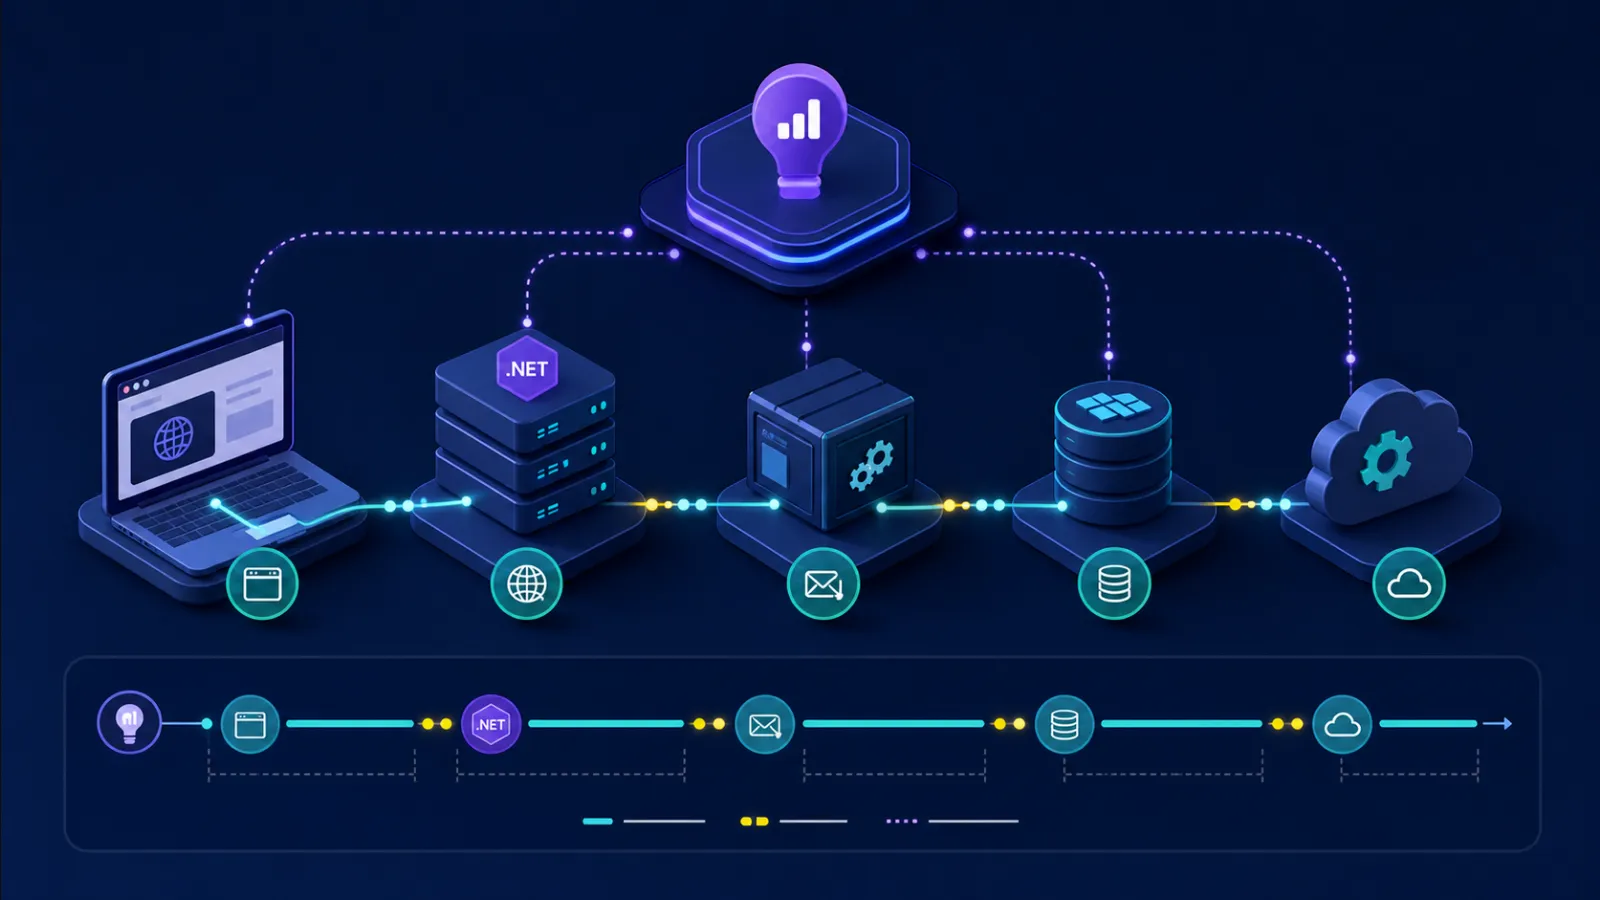
Start with decisions operators must make
“Is the service up?” is too shallow. Operators need to know which journey failed, where time was spent, whether data changed, which customers are affected and whether retry is safe. Define service-level indicators around successful business completion, latency and correctness before choosing dashboards.
Logs explain individual events, metrics reveal trends, and traces connect work across boundaries. One cannot replace the other. A trace sampled away cannot be reconstructed from aggregate metrics; a million unstructured logs cannot produce a reliable latency distribution.
Signal design
| Signal | Use | Failure mode |
|---|---|---|
| Metric | Rates, latency, saturation | High-cardinality labels explode cost |
| Trace | Cross-service causality | Broken propagation or harmful sampling |
| Structured log | Detailed investigation | Secrets and unbounded volume |
| Business event | Outcome and audit | Confused with diagnostic telemetry |

OpenTelemetry is the instrumentation boundary
Instrument .NET with OpenTelemetry APIs and exporters where practical so application code is not coupled to one backend. Application Insights can ingest traces, metrics and logs while Azure Monitor distribution handles platform integration. Use framework auto-instrumentation for HTTP, database and messaging, then add spans only around meaningful domain work.
Do not create a span for every method. Spans should represent remote calls, queues, durable steps or operations whose latency and failure matter.
Correlation needs propagation and causation
Propagate W3C trace context through outgoing HTTP and message properties. Async workflows can outlive the originating trace, so also carry durable operation and causation identifiers. Never use a trace ID as authorisation or a secret.
Record route templates, not raw URLs, as dimensions. Resource IDs, tenant IDs and exception messages create unbounded cardinality. Keep detailed identifiers in protected logs only when necessary.
Sampling is a correctness decision
Head sampling decides before the outcome is known and can discard rare failures. Tail-aware approaches preserve errors and slow traces but add pipeline complexity. Whatever the method, keep trace-consistent sampling so one operation is not represented by disconnected fragments.
Metrics for totals and error rates must not be inferred from sampled traces. Preserve low-volume critical workflows and record sampling rate when extrapolation is used.
Telemetry can leak more than logs
URLs, SQL, headers, exception messages and custom properties can contain tokens, personal data and document content. Redact before export, not after ingestion. Treat telemetry access and retention as a data-governance concern.
Avoid body logging by default. Stable error codes and safe identifiers usually diagnose more reliably than collecting entire payloads.
Alerts should describe actionable conditions
Alert on sustained user-visible failure, exhausted error budget, oldest queue age or dependency saturation-not each exception. Include scope, likely cause, dashboard and runbook. If nobody knows what action an alert requires, it is a notification.
Test alerts through controlled failure. A dashboard viewed only after incidents may already be broken or missing the decisive dimension.
Cost and retention are architecture
High-volume debug logs, custom dimensions and duplicate exporters can dominate monitoring cost. Set budgets by signal value, aggregate metrics, sample routine success and retain security/audit data under separate policies. Diagnostic telemetry is not an audit trail.
Production checklist
- Define user-journey SLIs before dashboards.
- Use metrics, traces and logs for distinct questions.
- Propagate trace context through HTTP and messages.
- Keep dimensions bounded and route-based.
- Preserve errors and critical journeys under sampling.
- Redact before export and restrict retention.
- Separate business audit from diagnostics.
- Alert only on actionable service conditions.
- Correlate releases and feature variants with outcomes.
- Test telemetry during dependency and queue failures.
Instrument business progression, not only framework activity
Request rate and exception count cannot tell whether invoices are stuck awaiting export or documents are accumulating in review. Define a small set of domain events and metrics for valuable journeys: accepted, completed, rejected, outcome unknown and time spent in each stage.
Keep business dimensions bounded. Tenant and customer IDs can produce high-cardinality cost and privacy concerns; use them in traces or controlled logs when diagnosis requires them rather than every metric label. Never place personal or secret values in span names.
A service can meet infrastructure availability while customer work has stopped. Business telemetry closes that gap and gives alerts a meaningful impact statement.
Correlation must survive queues and retries
HTTP trace context usually propagates automatically through supported instrumentation, but queued work needs explicit context. Preserve causation from the initiating operation while allowing the consumer to create a new span. One message delivered twice should show two attempts connected to one logical event.
Do not use a correlation ID as an idempotency key. Correlation explains relationship; idempotency controls business effect. Retried HTTP attempts and downstream calls should be children or linked spans rather than unrelated requests.
When crossing organisations, accept only valid trace headers and avoid trusting arbitrary baggage. Baggage can propagate sensitive or high-cardinality data far beyond its original service.
Sampling can erase the incident you need
Head-based sampling decides before a request's outcome is known and can drop rare slow or failed traces. Tail-based sampling can retain traces based on final latency or error but needs a collector capable of buffering and deciding after completion.
Metrics should remain representative even when traces are sampled. Keep errors, high latency and important business failures at higher rates, and understand whether sampling decisions propagate consistently across services. Independent sampling produces fragmented traces.
Do not solve cost by sampling logs indiscriminately. Audit evidence and security signals have different retention and completeness requirements from debug telemetry.
Application Insights is a backend, not the instrumentation contract
OpenTelemetry lets .NET applications emit traces, metrics and logs through a vendor-neutral model, while Application Insights can store and analyse them. This separation makes instrumentation more portable and clarifies where application-specific enrichment belongs.
Automatic instrumentation gives useful HTTP and dependency spans, but it cannot infer domain success. Add manual spans around meaningful operations and events at state transitions, not around every private method.
Standardise service name, environment, deployment version and operation conventions. Inconsistent dimensions make cross-service queries unreliable even when every component emits data.
Telemetry pipelines fail too
Applications should not stop serving because the telemetry backend is slow. Export asynchronously with bounded buffers and observe dropped telemetry. Unlimited buffering converts an observability outage into memory or disk exhaustion.
Developer-mode or synchronous export is useful locally and harmful under production load. Verify batching, retry and shutdown flush behaviour, especially for short-lived workers and functions that may terminate before export.
Telemetry loss needs visibility, but avoid recursive storms where exporter failures generate more telemetry than normal traffic. Use internal diagnostics and a separate health signal where practical.
Alert on exhausted recovery, not every symptom
Page when a person can take an action: sustained customer failure, queue age beyond objective, reconciliation backlog, error-budget burn or capacity nearing exhaustion. A single transient exception is usually evidence for a trace, not an incident.
Combine fast-burn and slow-burn alerts so severe outages page quickly while gradual deterioration still surfaces. Include scope, likely dependency, dashboard and runbook in the alert. If responders begin by discovering what a metric means, alert design is unfinished.
Review alerts after incidents and remove permanently ignored rules. Alert fatigue is not a human weakness; it is a faulty signal-to-action contract.
Retention and access are security decisions
Telemetry often contains URLs, user identifiers, database statements and exception data. Minimise at source because downstream redaction cannot reliably erase every copy. Restrict query and export permissions and audit high-impact access.
Choose retention per signal and investigation need. Long retention increases cost and exposure; short retention can make slow fraud or reliability patterns invisible. Aggregate durable metrics while allowing verbose traces to expire sooner.
Test that support can diagnose representative incidents without raw customer payloads. Good context and stable identifiers reduce the temptation to log everything.
Dashboards should lead from symptom to evidence
A useful dashboard starts with service objectives and customer journeys, then lets an operator narrow by version, region, dependency and failure class. A wall of infrastructure charts forces responders to invent the investigation path during an incident.
Preserve deployment and configuration annotations on the same timeline. Many regressions align with change, but correlation should prompt investigation rather than automatically blame the newest release. Link panels to representative traces and logs so summary and detail use the same definitions.
Related C3 Software guides
Frequently asked questions
Is Application Insights the same as OpenTelemetry?
No. OpenTelemetry defines instrumentation and transport standards; Application Insights is an Azure telemetry service and backend.
Should every request be traced?
Not necessarily. Sample routine traffic while preserving errors, slow operations and critical journeys.
Can logs be used as an audit trail?
Usually not. Audits need durable domain semantics, integrity, access and retention beyond diagnostic logs.
What causes Application Insights cost spikes?
Verbose logs, high-cardinality properties, duplicated telemetry and excessive retention are common causes.
Instrument what the business needs to know
For a .NET observability review, talk to C3 Software.